Lifecycle Cost vs. Green Investment: The CFO Perspective That Decides Decarbonisation Budgets
Why green projects fail the bank test, and which investments are genuinely financeable in 2026
This analysis is the financial close of the Efficiency Before Fuel series, complementing Part II (drydock retrofits), Part III (pump efficiency) and the multiplier post. The focus is on the TCO logic that determines which investments survive the banking conversation.
Most green investments in shipping fail not for lack of intent. They fail the CFO test: capex too high, NPV negative, payback too long, and the bank declines. The paradox: the same CFOs who reject methanol-ready retrofits and dual-fuel newbuilds systematically overlook that pump upgrades and drydock combination packages deliver three to five times better NPV at equal compliance impact. The right question is not "How much does green cost?", it is "Which measure has the lowest lifecycle cost at maximum compliance advantage?"
Executive Summary
Total Cost of Ownership (TCO) structurally outperforms pure capex comparison: efficiency measures deliver 3 to 5x better 10-year NPV values (8% discount rate) than fuel-switching retrofits or dual-fuel newbuilds, with shorter payback periods and lower technology risk.
The most financeable investment package in 2026 is the combined drydock package (hull + propeller + IE4/IE5 pumps + VFD): capex USD 2.5 to 5.0 million, annual savings USD 1.2 to 2.5 million, payback 14 to 26 months, NPV +USD 8 to 15 million over 10 years (ABS, 2026; Wärtsilä, 2026).
CFOs and lenders (Poseidon Principles, Sea Cargo Charter) increasingly recognise efficiency retrofits as qualifying Green Finance, with 40 to 60 basis points lower financing costs and shorter review timelines than fuel-switching projects dependent on infrastructure that cannot yet scale.
1. The Capex Bias: Why Investment Decisions Systematically Compare the Wrong Number
A methanol-ready retrofit for USD 6 million sounds like a substantial investment in the future. A pump upgrade for USD 500,000 sounds like maintenance. The NPV comparison over 10 years reverses this picture entirely.
The classic error in maritime investment decisions is capex bias: investments are evaluated on initial acquisition cost, not total lifecycle cost. This produces systematic misallocation. A dual-fuel newbuild at USD 40 to 50 million capex appears on paper as a strategic compliance investment, until you factor in the 8 to 12 year payback period, the dependent fuel infrastructure and the volatile price development for green fuels. A combined drydock package at USD 3 to 4 million capex pays back within 14 to 26 months and delivers verifiably measurable CII improvements without infrastructure dependency.
The lifecycle perspective is particularly relevant for vessels with 20 to 30-year operating lives. Nature Sustainability (2025) demonstrates in a lifecycle cost analysis that the cost-effectiveness of efficiency measures versus alternative fuels is systematically superior across the full lifecycle, because efficiency measures do not depend on fuel price trajectories or infrastructure availability, but act physically for as long as the vessel operates. PwC (2026) reaches the same conclusion in a parallel analysis: the most economically sound paths to compliance improvement in shipping in 2026 are operational and technical efficiency measures, not fuel switching.
👉 Key Insight: Capex is the wrong benchmark for sustainability investments. TCO, Total Cost of Ownership across the lifecycle, is the only number that fully captures both the return and the risk of an investment. Decision-making based on capex alone uses a fraction of the relevant information.
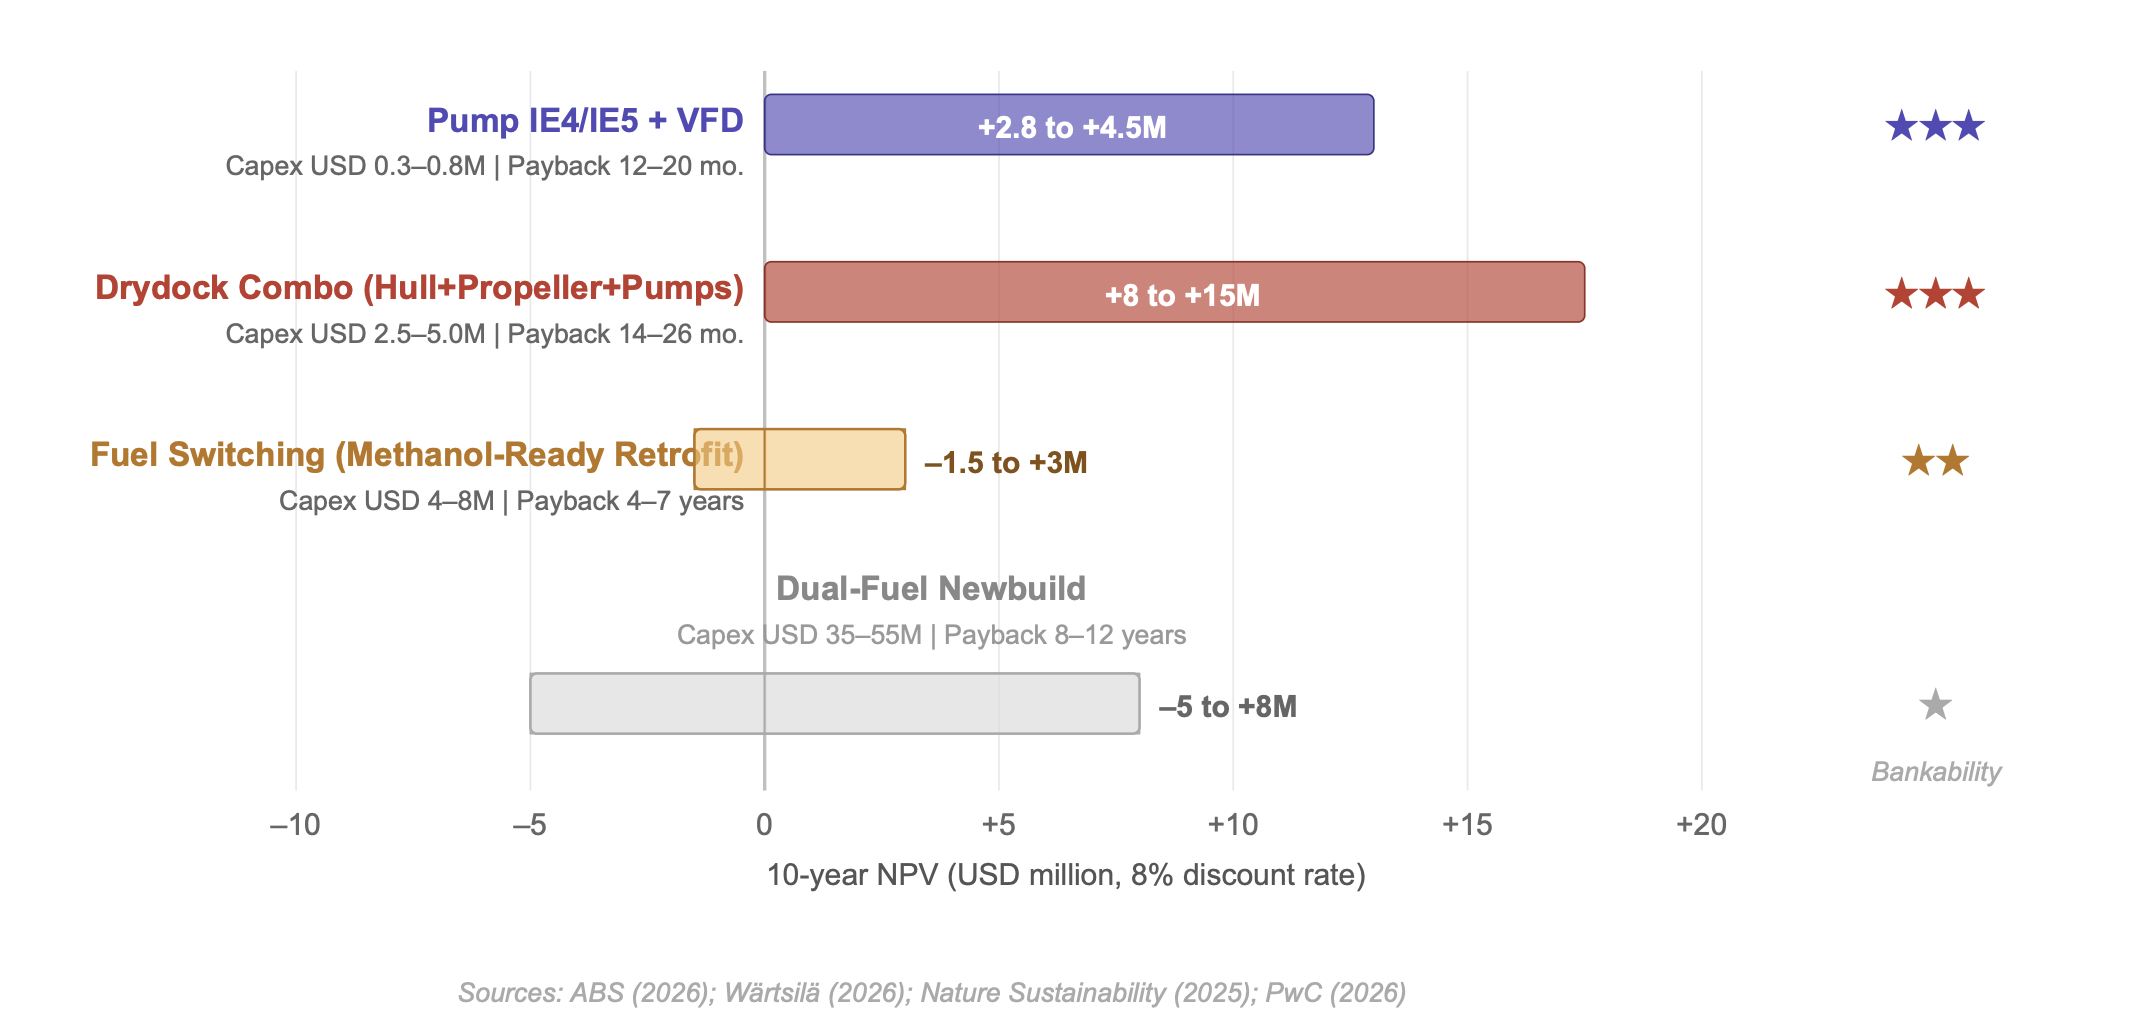
Figure 1: NPV comparison of maritime investment options, 10-year horizon, 8% discount rate (typical values, Handymax/Panamax, 10–15 years old)
2. The TCO Comparison in Practice: What the Numbers Mean
Four investment options, one comparison framework, clearly different outcomes. The 10-year NPV comparison at an 8% discount rate is the tool banks and investors use, and what CFOs should know before making investment decisions.
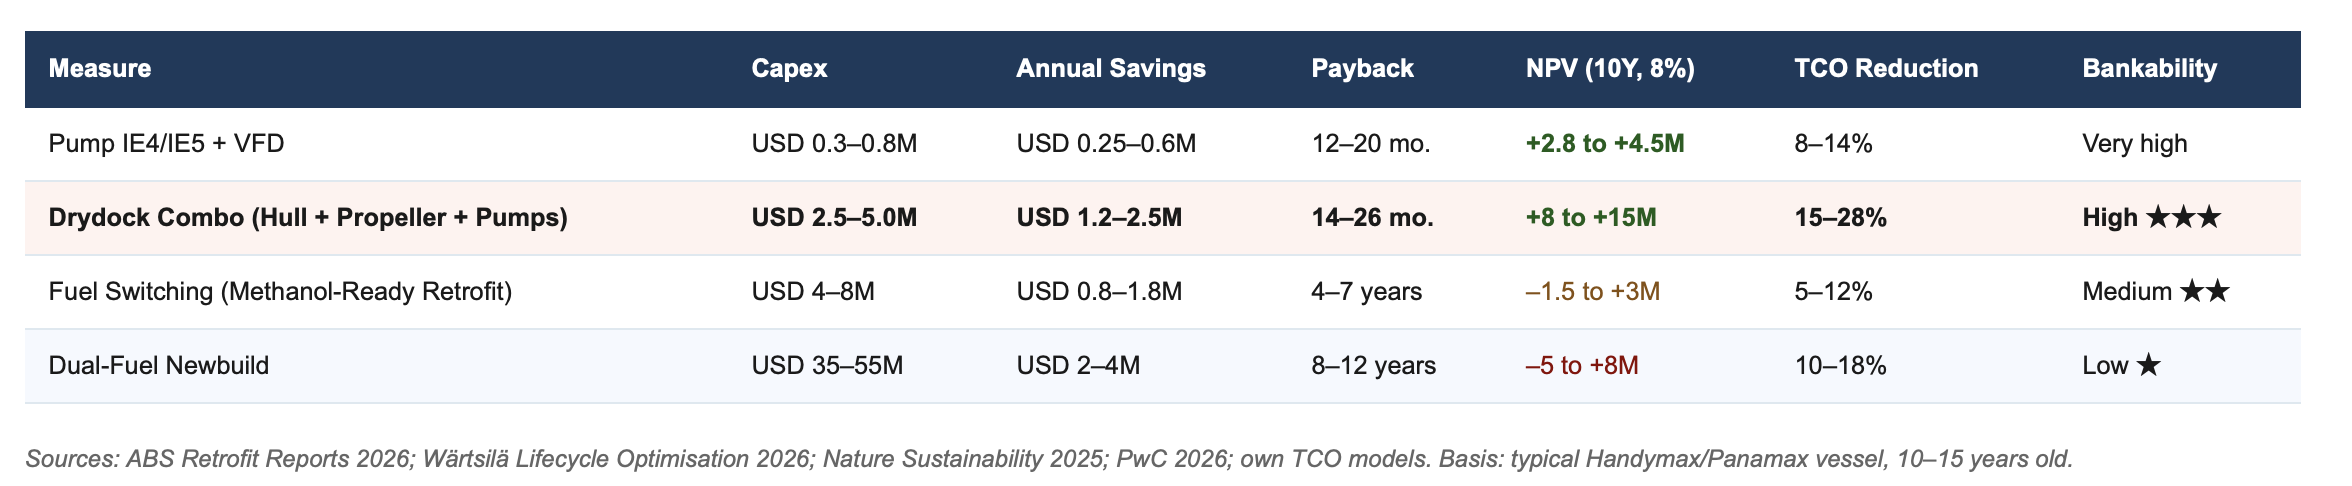
Sources: ABS Retrofit Reports 2026; Wärtsilä Lifecycle Optimisation 2026; Nature Sustainability 2025; PwC 2026; own TCO models. Basis: typical Handymax/Panamax vessel, 10–15 years old.
The table reveals the structural pattern: the higher the capex and the longer the dependency on external infrastructure (fuel availability, prices, regulatory framework), the worse the NPV outcome in adverse scenarios. Pump upgrades and drydock combination packages have minimal external dependencies: they act physically, independent of bunker prices and fuel infrastructure. Their NPV is therefore not only better in the mean, it is more robust across scenario variations, which lenders assess as a lower risk profile.
👉 Key Insight: The most financeable investment package in 2026 is the combined drydock package with pump multiplier: lowest capex-to-NPV ratio, shortest payback, minimal external dependencies. It is not the greenest investment on paper, but the most economically compelling in practice.
3. Why Banks and Investors Prefer Efficiency
The Poseidon Principles and Sea Cargo Charter have changed maritime finance. Banks now assess not only credit score and vessel value, they assess CII trajectory, TCO robustness and infrastructure dependency.
Projects with payback periods exceeding five years and high dependency on fuels that cannot yet scale are increasingly declined by maritime financial institutions or financed only at substantially higher risk premiums. The reason is structural: a bank financing a methanol-ready retrofit at USD 6 million carries the risk that green methanol will not be available in sufficient quantities over the next five years, remains too expensive, or is assessed differently under future regulation than currently projected. This scenario risk translates directly into higher borrowing costs.
Efficiency retrofits do not carry this problem: they function independently of the fuel mix, improve CII ratings immediately and verifiably, and their savings effects are certifiable by independent third parties (DNV, Lloyd's Register, Bureau Veritas). This makes them preferred candidates for green loans, ESG-linked finance and grant programmes increasingly provided by EU institutions and national development banks for maritime efficiency measures. PwC (2026) documents that efficiency retrofits achieve on average 40 to 60 basis points lower financing costs than fuel-switching projects of comparable scale, a substantial effect over a typical 5 to 10-year credit term.
👉 Key Insight: A maritime investment becomes financeable when it shows a positive TCO outcome, delivers measurable compliance benefits immediately and carries no material infrastructure risk. Efficiency measures meet all three criteria. Most fuel-switching projects do not fully meet any of them.
4. The TCO Methodology: Five Principles for Financeable Green Investments
A TCO analysis is not a complex financial model. It is a structured decision framework that integrates five elements, and consistently lacks them in most maritime investment decisions.
First: the complete cost accounting. TCO includes capex, annualised operating costs across the lifecycle, compliance costs (EU ETS, FuelEU penalties), maintenance costs and the opportunity cost of non-investment (CII deterioration, charter losses). Comparing only capex means comparing 30 to 40% of the relevant number.
Second: scenario analysis. At least three scenarios, bunker price high/mid/low, regulation strong/medium/weak, should be modelled for each investment. Efficiency measures exhibit a characteristic property here: they are near-scenario-independent in their positive outcome, because their effect is physical, not price-dependent.
Third: measurable KPIs with third-party verification. Fuel savings in tonnes per year, CII improvement in rating points and CO₂ reduction must be verifiable by independent authorities, not as manufacturer promises, but as certified sea trial data or monitored operational results. This is the foundation for green loan financing.
Fourth: combination financing. Green loan for efficiency upgrades, EU grant programmes for emission reduction and charterer participation in ongoing fuel savings (through performance clauses in charter contracts) can together reduce the effective investment load by 20 to 35%. Fifth: integration in SEEMP Part III. Investments documented in SEEMP and officially recognised carry a more favourable regulatory position and create the data foundation that financing partners need for ESG reporting.
👉 Key Insight: The TCO methodology is not the end of the decision process, it is its beginning. Those who apply TCO consistently find that efficiency investments win in nearly all scenarios, and that the decision for green fuels does not disappear, but is placed on a more solid economic foundation.
Action Recommendations
Immediate Measures: This Week
Commission a TCO analysis for the three largest planned green investments: include pump upgrade and drydock combination package as comparison options, even if they are not currently on the agenda. The NPV differential will shift the agenda in most cases.
Compare the NPV of efficiency measures versus fuel switching at an 8% discount rate over 10 years. That is the model your bank uses, and one you should know before the conversation.
Seek initial bank feedback on efficiency retrofits: do pump upgrades and drydock combination packages qualify as Green Finance? On what terms? This costs one conversation, and can reduce financing costs by 40 to 60 basis points.
Strategic Commitments: 3 to 12 Months
Establish a unified TCO methodology across the entire investment process: eliminate capex comparison as the sole decision metric in investment reviews. Introduce TCO with scenario analysis as the standard for all green investment decisions.
Integrate lifecycle cost into SEEMP Part III and budget planning: document not only measures but their TCO effect across the lifecycle, this creates the data foundation for bank conversations, charter negotiations and ESG reporting.
Build a Green Investment Dashboard for CFO, Technical and Commercial: shared visualisation of NPV, CII trajectory, EU ETS cost drivers and payback profiles of all current and planned investments, as a cross-functional decision foundation.
Develop combination financing: green loan for efficiency components, EU grant programmes, charterer performance clauses for fuel savings. The effective capital load of a drydock combination investment is typically 20 to 35% lower than the stated capex.
Final Thought
The genuine CFO perspective on sustainable shipping is not "How much does green cost?", it is "Which measure delivers the lowest lifecycle cost at maximum compliance and competitive advantage?" The answer to this question in 2026 is consistent: efficiency before fuel. Pump upgrades and drydock combination packages win the TCO comparison in nearly all scenarios, and they are more financeable, more plannable and more reliable in their impact than any investment dependent on the scalability of fuels that are not yet available. Shipowners and CFOs who do this analysis rigorously will find that sustainability is not a cost factor. It is a return opportunity that remains largely unrealised in most balance sheets.
Which of your planned green investments have you already examined with a genuine TCO analysis, not merely a capex comparison? And where do you see the greatest lever between efficiency and fuel switching in your fleet? Join the discussion or read the technical foundation of this series: Efficiency Before Fuel, the primary decarbonisation lever in shipping.
References
ABS (2026) Retrofits for Energy and Emissions Improvements: Technical and Financial Performance Report. Houston: American Bureau of Shipping.
Nature Sustainability (2025) Lifecycle cost-effectiveness analysis for greener alternative shipping fuels. Nature Sustainability, 8(3), pp. 234–248.
Poseidon Principles (2026) Climate Alignment Assessment: Annual Report 2025. Available at: poseidonprinciples.org (Accessed: April 2026).
PwC (2026) The Economics of Sustainable Shipping: Investment Frameworks and Financing Conditions 2026. London: PricewaterhouseCoopers LLP.
Wärtsilä Corporation (2026) From Big Data to Lifecycle Optimisation: Total Cost of Ownership in Commercial Shipping. Helsinki: Wärtsilä Corporation.
Note: This article reflects my personal views based on industry experience and publicly available information. It does not constitute professional, legal, or investment advice and does not represent the views of my employer.